Guide to incrementality:

AUTHOR
Paid Performance Operations Director
As Paid Performance Operations Director, Becky leverages her years of paid media expertise to develop efficient processes and innovative tools as well as impactful training programs that promote continual learning and empower the team to deliver consistently exceptional paid search and social campaigns.
SHARE
OVERVIEW
DOES SHOWING ADS IMPACT CUSTOMERS’ BEHAVIOUR?
How do you know that the revenue you see in Google Analytics next to ‘Paid Search’ is solely due to the adverts that you’re paying to serve, and wouldn’t have been captured anyway by, say, strong organic listings?
Incrementality is a made-up word but, come on, it’s marketing so that doesn’t really matter. 4,400 searches per month on Google – increasing by 180 searches per month in the UK – is the only dictionary definition we need to justify our use of the term.
Run-of-the-mill KPI marketing is obviously great for measuring the last-click (last non-direct click) value of various channels, campaigns, keywords etc. but it’s completely uninformative when it comes to real value added. Even using multi-touch attribution modelling or Google’s latest and most complex marketing attribution product cannot impart the insight necessary to measure incrementality.
The real value of digital marketing is in the incremental sales; the sales that would not have happened without your genius. This article is going to give you our tried and tested recipe for measuring the incremental value of advertising and help you interpret and communicate the results.
WHO SHOULD READ THIS?
- Marketing managers looking to justify the value of their chosen agency.
- Analysts tasked with judging the performance of an experiment.
- An agency trying to prove their worth.
- A business wanting to check if they’re spending money intelligently.
- Anyone who wants to understand the real value added by their marketing.
WHAT DOES ‘INCREMENTALITY’ REALLY MEAN?
In plain English, incrementality is the lift that marketing and advertising provide above the native demand. Native demand here refers to the sales that occur without any advertising influence. The difference between native demand and ad-driven sales represent incremental lift – the increase in sales that
is truly attributable to paid media.
It is the gold standard of marketing measurement. By doing it effectively, you can begin to quantify the impact of ads on your business and honestly claim responsibility for the results of your work.
YOU MAY HAVE HEARD MANY OTHER SIMILAR TERMS. THEY’RE ALL INTERCHANGEABLE AND IN- CLUDE:
- Uplift analysis.
- Incremental uplift analysis.
- Incremental lift analysis.
- Lift analysis.
- Incrementality.
- Incremental lift.
- Incremental revenue.
- Conversion lift.
- Additional elevatory examination.
Now, if you’re not technical, this is the time to Slack the article to your analyst and ask them for some of that lovely incrementality ‘stuff’.
HOW TO ACTUALLY MEASURE INCREMENTALITY.
WHAT IS AN INCREMENTAL LIFT TEST?
Experiments relying on treatment and control groups are the scientific gold standard in determining what works and what should play an important role in an advertiser’s attribution strategy.
Your incrementality experiment should have two main features:
- A well-defined test group that will no longer be served ads.
- A carefully matched control group with a level of spending consistent with the past three months at least.
GHOST ADS.
Our methodology is inspired by a Think With Google article about revolutionising the measurement of ad effectiveness. Google describes it as “an ideal solution for ad experiments”, far superior to placeholder or “intent-to-treat” campaigns because it takes users’ exposure into account (rather than forming test groups from people who may or may not have seen the ad in the first place). Ghost Ads refine treatment and control groups by recording which users would have been exposed to the ads – it’s a fair and informative apples-to-apples comparison.
In simpler terms, the idea is that your test subjects should be people who would have been shown an ad only, and not be distorted by including users who would have never seen your ads anyway. You can run this in Google Ads by performing a Conversion Lift Test but the process is not straightforward and not available to everybody. Besides, this approach is very specific to Google Ads only. What we describe here is more generally applicable to any kind of campaign or activity you wish to measure.
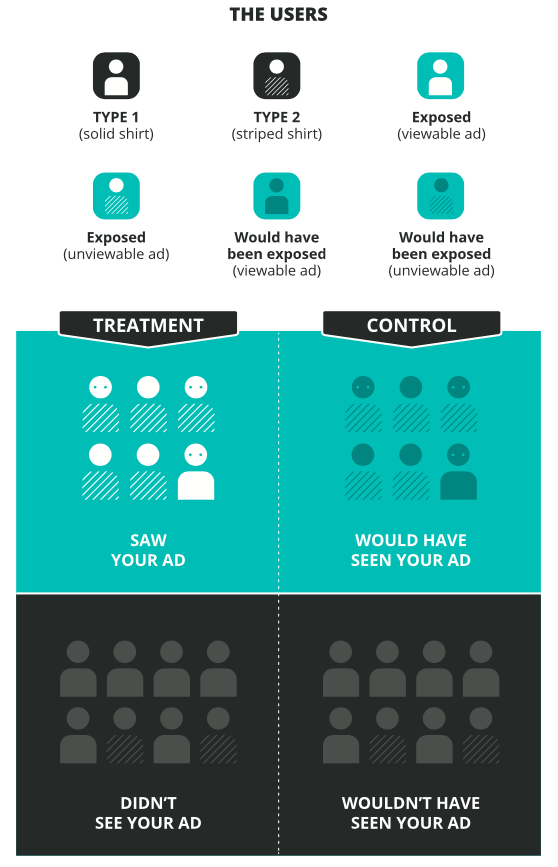
Ghost Ads. “Ghost ads allow us to record which users would have been exposed and other exposure-related information such as ad viewability for the ghost ads to further improve measurement. The best ad effectiveness comparison would be to compare the users in the green region whose ads were viewable (i.e., with eyes).” Source
SELECTING YOUR TEST SUBJECTS.
WHAT DOES ‘AUDIENCE’ MEAN TO YOU?
We often find it useful to separate audiences by geography. This makes targeting a lot more straightforward and keeps audiences reliably separated. That means we don’t have to worry about our test and control groups overlapping and muddying the data. If we’re running a paid media campaign, then ad platforms (such as Google Ads, Facebook Ads etc.) are particularly good at targeting ads to specific cities. If it’s a billboard, you can measure offline sales from bricks-and-mortar store locations and online sales using the billing addresses of online customers.
For example, if we have a UK-wide audience, we might class our ‘audiences’ as cities. Birmingham would be one audience, Portsmouth another, and so on.
The next step is deciding how to split your audiences. You’re not going to compare a bustling population dense city like London with the small, quiet, Welsh town of Llanfairpwllgwyn-gyllgogerychwyrndrobwllllantysiliogogogoch. Using Google Analytics, you can easily build profiles of every city that drives value for your business.
For example, you might construct a table that looks like the one shown below.
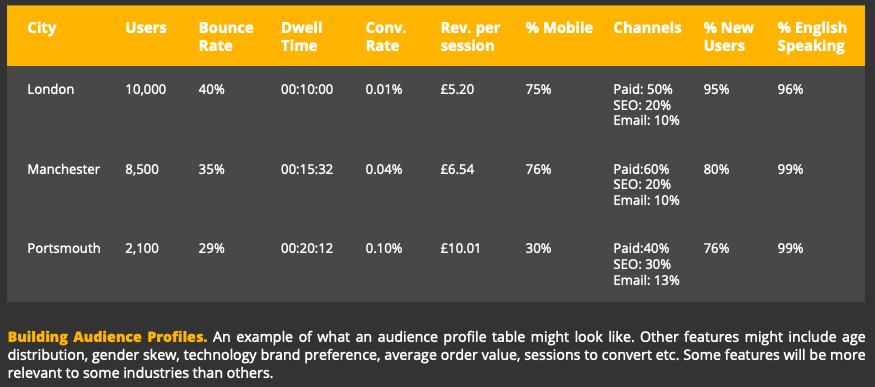
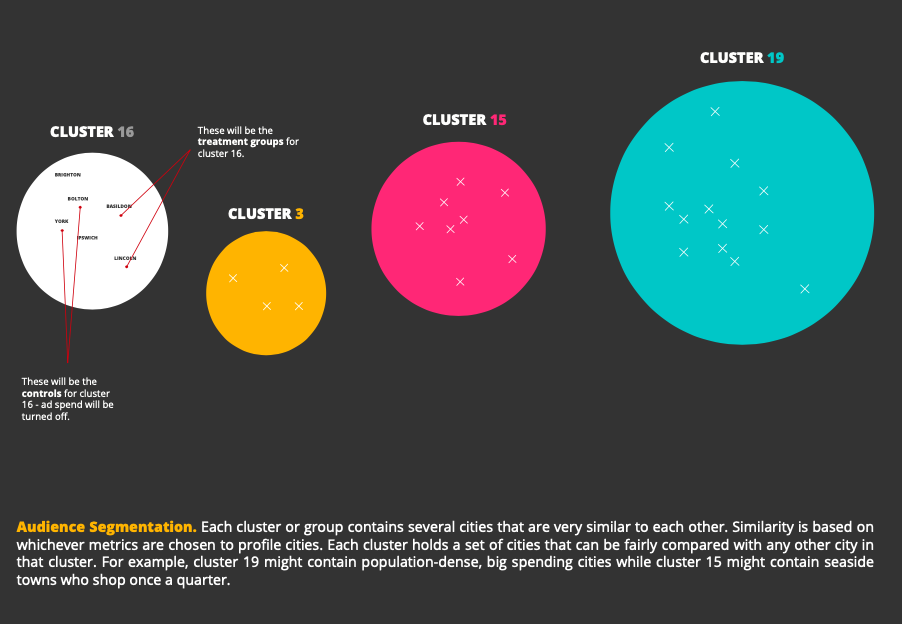
Once you have a profiled snapshot of every city, you can start dividing them into groups. You can think of each group as a collection of very similar audiences. One group might have a strong preference for mobile and very high site engagement for example, another group might have a strong preference for tablet and very similar conversion rates.
From each group, you can then randomly select cities that would be fair to compare against each other.
When you have hundreds or thousands of cities, this is not something that can be performed manually. You don’t need to be a proficient coder though, there are some free online tools that will help you automate the clustering of cities. Just Google “free k means clustering tool”.
To capture the full diversity of your audience, it’s a good idea to select an even number of cities from each of your clusters, so you can divide them equally between test and control groups.
Note that cities within a cluster can be aggregated to measure performance but each cluster should be measured apart from each other. This is because clusters with smaller cities will become lost in the data when combined with much larger ones and valuable insight into the performance of different audience will be buried.
RUNNING THE EXPERIMENT.
Since we have identified similar audiences, we can assume that they will behave in similar ways. To measure incremental uplift, we have found that monitoring the difference in performance between test and control groups is the most robust way of analysing performance.
This method accounts for seasonality, holidays, and any sales-type events that may be running (although we don’t recommend running it through a Black Friday or Christmas period) because if one group dips due to, say, a slow summer, we can expect the other group to follow suit.
This is important because we’re not only trying to prove that the marketing campaign is better than no marketing campaign – we need to be able to calculate the precise incremental value it added.
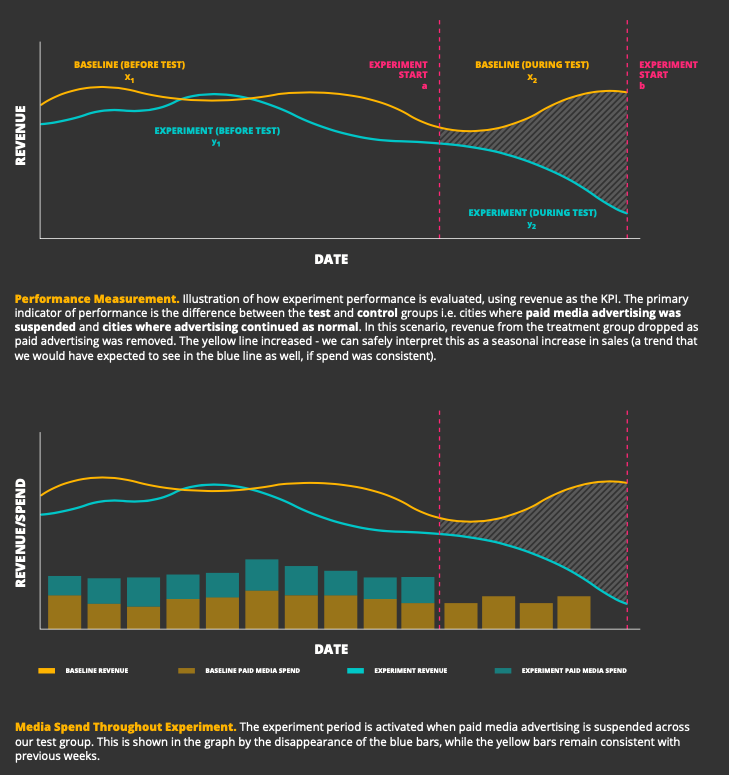
The charts below illustrate how our selected test and control groups should be monitored throughout the experiment. The three-month baseline leading up to the experiment provides a benchmark of the difference in revenue between the control and test groups. How this difference changes during the experiment allows us to calculate the impact of advertising.
It is crucial that the level of media spend in the baseline group is consistent with the historical data you plan to use as a benchmark. For example, if you typically spend between £1,000 and £1,250 a day on ads, this must remain the case during the experiment period as well.
Right away, we can see an incremental value of advertising. The next question is then, how do we quantify that difference?
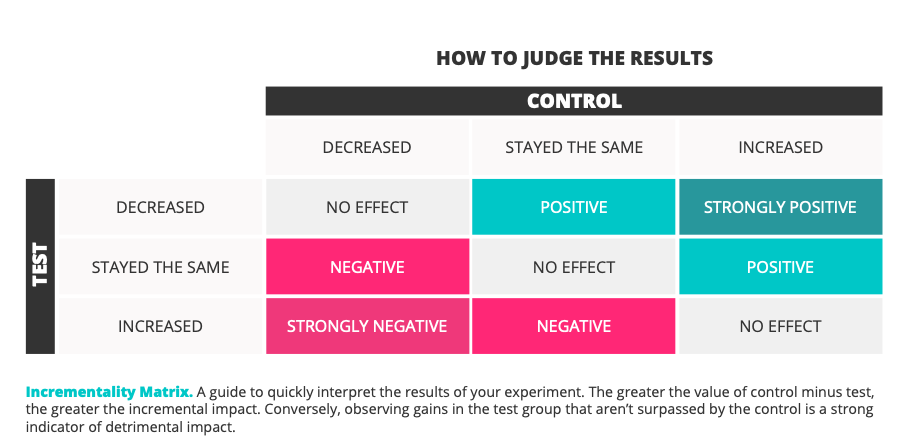
STOPPING THE EXPERIMENT.
Tests of statistical significance will help you decide whether you have collected enough evidence to end your experiment. An acceptable significance level stands at 95% but, ultimately, it’s a balance between how much you’re willing to invest in the experiment versus how solid you want your conclusions to be. If the lack of advertising is costing you a lot of money, you might want to stop the experiment at 90% significance. The earlier you stop it, the more risky your conclusions will be.
Statistical significance is one of those terms we hear all of the time without actually knowing what it is. In plain English, a significance of 90% would mean that if you were to run the same experiment again, you can be confident that nine times out of ten you would get the same result. There’s also a 10% chance you could be wrong.
Personally, Bayesian estimation is our weapon of choice for measuring statistical significance. However, there are many free online tools that take care of all the maths for you e.g. Google “statistical significance calculator”.
A WORD OF ADVICE.
Try not to rely on Google Analytics to measure city-level performance because it won’t be precise enough to be meaningful, or even make sense. We advise using customers’ billing addresses instead, if you have access. This is because of Google Analytics’ method of location targeting.
Google Analytics and the advertising platforms track user location very differently.
The ad platforms are much more specific. For example, Google Ads uses a combination of GPS, Wi-Fi, Bluetooth and Google’s mobile ID (Google phone masts) location database. Google Analytics’ location data points come from IP addresses only – and IP address locations are approximate since the data comes from a third-party IP database. Google specifically acknowledge that IP data can be inaccurate since IP addresses are routinely reassigned, not to mention that the third-party IP data isn’t guaranteed to be 100% accurate either.
Note that the audience selection method outlined above is still valid. However, because it does not rely on precise location targeting, it’s more about relative trends.
QUANTIFYING THE IMPACT.
Calculating incremental lift figures is achieved in three steps. It gets a little tricky but stay with me. Here is a visual illustration of what we are trying to achieve:
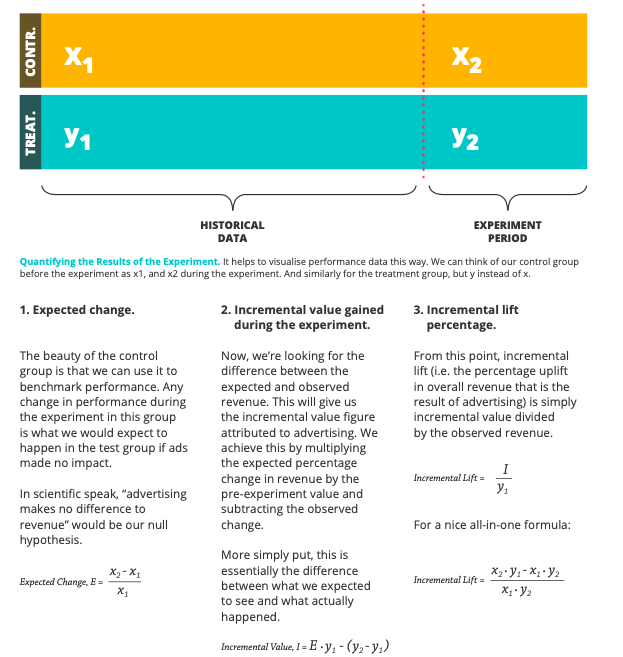
FRAMING THE RESULTS.
The incremental value figure calculated shows you how much revenue was driven by advertising in a subset of the geographies you advertise in. What happens when you scale that figure across your entire market? Then across an entire financial year? How does the incremental value of your advertising look then?
Take it further. If you know how much you’ve spent, you can calculate an incremental ROI figure. The ROI figure shows how much revenue you actually make on top of what you would have made anyway for every £1 you invest.
Numbers are great (I’m a data scientist, I would know) but they make a lot more sense in context. Usually, you would run the experiment over a period of only several months. Although, given unlimited resources, I would opt for an always-on experiment to constantly monitor incrementality. Once you know your incremental uplift percentage, you can apply it in different scenarios. How much incremental revenue can you attribute to advertising over the course of an entire year, for example?
In fact, we recently ran an experiment just like this for one of our clients.
Our goal was to measure the incremental impact of paid media advertising, in particular across Google Ads, Bing Ads and Facebook Ads. We were able to prove that the incremental value
of paid media was actually higher than the overall share of revenue attributed to those channels on a last click basis – i.e. as reported in Google Analytics. This means that the revenue generated by paid media as we reported it was an underestimation of how much value it was really delivering.
We interpret this as evidence of cross-channel attribution – the halo effect of paid media advertising. Proof that the value of advertising is seen in other channels like Organic Search, Email, and even offline purchases. Furthermore, the majority of our campaigns contained non-brand keywords, alluding to the power of paid advertising in generating brand awareness via generic keywords, which can be swept up by othe channels.
CONCLUDING REMARKS.
As a data scientist I know how dangerous proclaiming a causal impact between two variables is. There are a lot of different and impossible-to-measure variables in play at any time. Controlling for all of these factors is just not plausible.
However, this is about actionable insight – it’s about getting as close to the truth as possible. We can be mindful of external circumstances and have a solid grasp of our domains – elections, sales, climaxes of reality TV shows etc.
If you want to measure the real impact of something, this really is the only way you can do it.
LOOKING FOR AN INCREMENTAL UPLIFT ANALYSIS?
We’re an independent multi award-winning, digital growth agency who move fast, work smart and deliver stand-out results.
A team of growth hackers, analysts, data scientists and creatives, we design data-driven strategies to rapidly take your brand from the here and now to significant growth through frictionless user journeys.
Through our methodical data-driven approach, we find untapped, sustainable, growth opportunities for our clients.
If you would like to talk to an expert about creating a marketing incrementality study for your business, then get in touch.
Becky James, Paid Performance Operations Director - 09 Nov 2020
Tags
Data, Digital Marketing, Measurement, Paid Media, PPC,
Date
09 Nov 2020